 |
|||
|
|
|||
|
|
|||
| ||||||||||
|
| 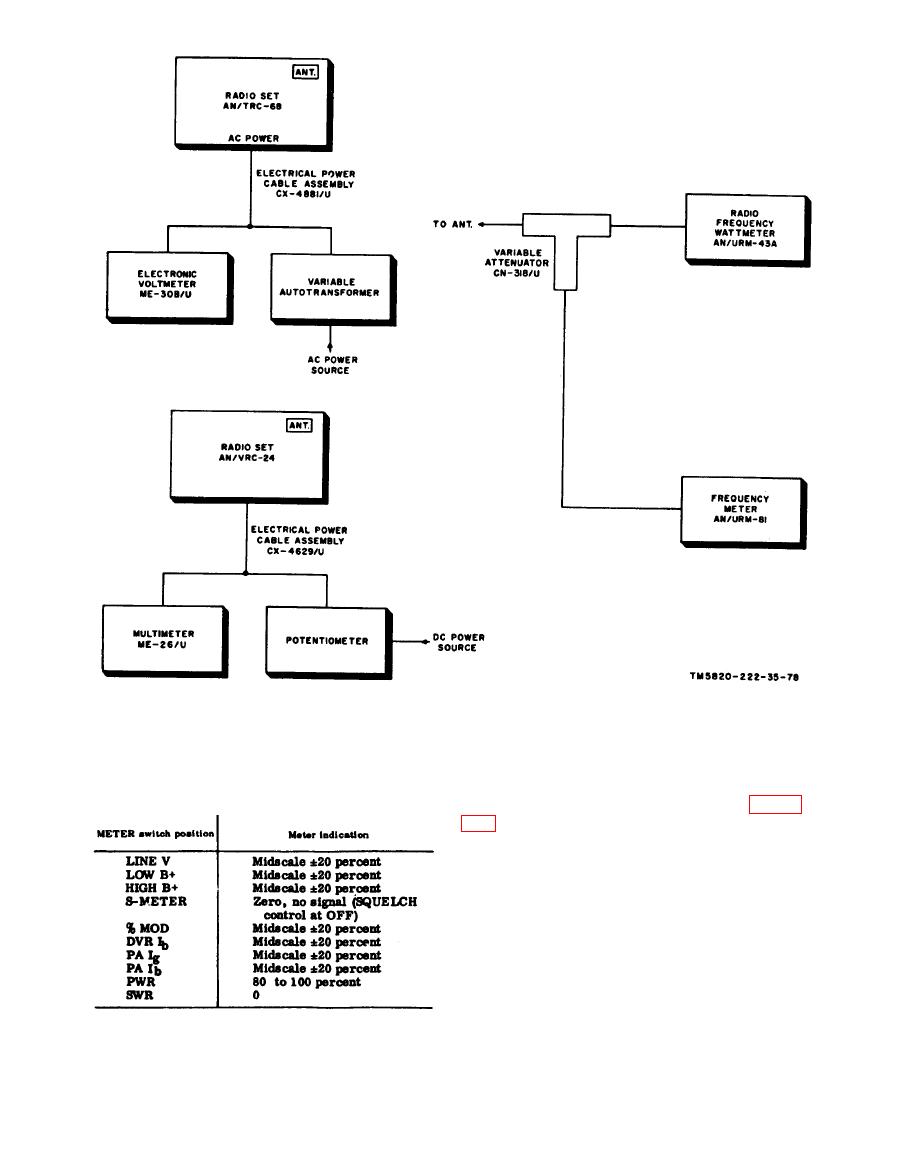 Figure 114. Frequency stability vs supply voltage test setup, block diagram.
SWR and PWR on transmit. Check % MOD
while speaking into the microphone. The
Connect the AN/VRC-24 or AN/TRC-68
following chart lists normal indications.
and the test equipment as shown in figure
a. Tune the radio set to 399.9 mc and
turn the VOLUME control fully clockwise.
b. Set the TS-497/URR to 399.9 mc. Set
the METER switch to S-METER and tune
the TS-497/URR for a maximum indication
on the meter.
c. Modulate the TS-497/URR output sig-
nal at 30 percent with a 1,000-cycle audio-
d. Adjust the MICROVOLTS control on
|
|
Privacy Statement - Press Release - Copyright Information. - Contact Us |
