 |
|||
|
|
|||
|
Page Title:
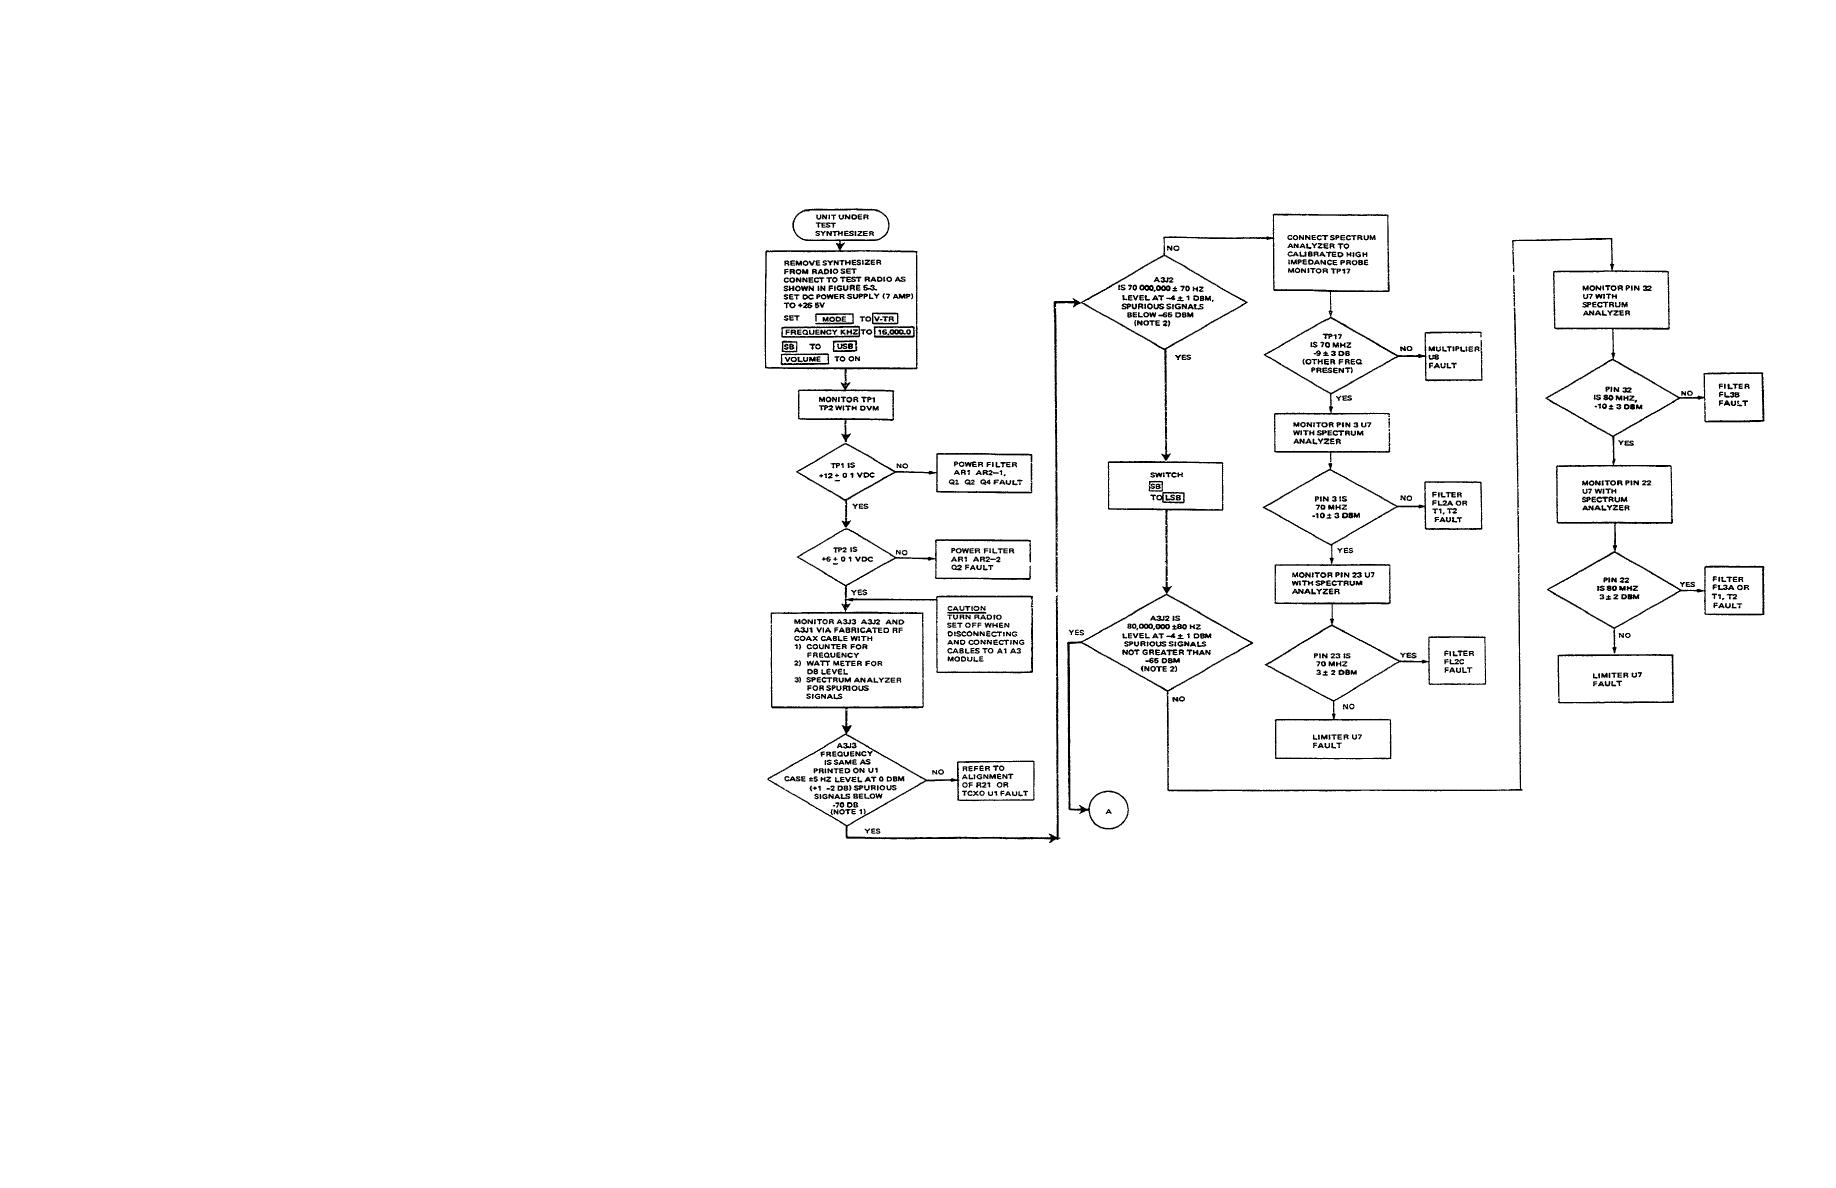
Figure 5-4. Synthesizer A1A3 Performance Test (Sheet 1 of 2) |
|
||
| ||||||||||
|
|  TM 11-5820-919-40-2
SYNTHESIZER PERFORMANCE TEST
NOTE 1: Spurious signal applies between 4.995 and 5.005 MHz. Set spectrum analyzer at:
Log Reference Level
10 db
Linear Sensitivity
0
1 kHz
Scan Width
10 kHz/div
Scan Time
2 sec/div.
Video Falter
10 Hz
Center Frequency
5 MHz
10 db Log
Input Attenuation
30 db
Range
0-110 MHz
Storage
STD
Scan Mode
SINGLE
NOTE 2:
Spurious signal applies between 40 and 90 MHz. Set spectrum analyzer at:
Log Reference Level
0
Linear Sensitivity
0
300 kHz
Scan Width
10 MHz/div.
Scan Tome
10 ms/div.
Video Falter
10 kHz
10 db Log
Input Attenuation
20 db
Center Frequency
70 MHz, USB
Range
0-110 MHz
Scan Mode
INT
NOTE 3:
A3J1 output IS frequency kHz plus 75,000 kHz. Spurious applies between 60 and 110 MHz.
If output power IS low, adjust R19 of VCO (U3). If unable to raise power, continue with
troubleshooting flowchart.
NOTE 4:
Spurious signal applies between 60 and 110 MHz. TP5 frequency is 70,090,000 Hz + XY,
where X is 1 kHz frequency kHz digit and Y is 100 Hz frequency Hz digit. Set spectrum
analyzer as in Note 2, except that the center frequency is 91 MHz.
NOTE 5:
When 1 kHz digit of frequency kHz is 0, TP15 voltage is 3v. When this same digit is 9, TP15
is 9v.
NOTE 6:
Unless otherwise specified, all voltage measurements taken with respect to chassis ground.
NOTE 7:
If the phase locking action of the synthesizer is functioning correctly, TP4 voltage would be
6v. Since it IS not locking, U2 should be pruned at one end or the other of the 3 to 9v VCO
tune voltage.
NOTE 8:
Low frequency adjust transformer T3 must be replaced and returned as specified on
paragraph 5-9 whenever low frequency loop filter hybrid (U5) is replaced.
TM-07748A-45/3
Figure 5-4. Synthesizer A1A3 Performance Test (Sheet 1 of 2)
51
|
|
Privacy Statement - Press Release - Copyright Information. - Contact Us |
