 |
|||
|
|
|||
|
Page Title:
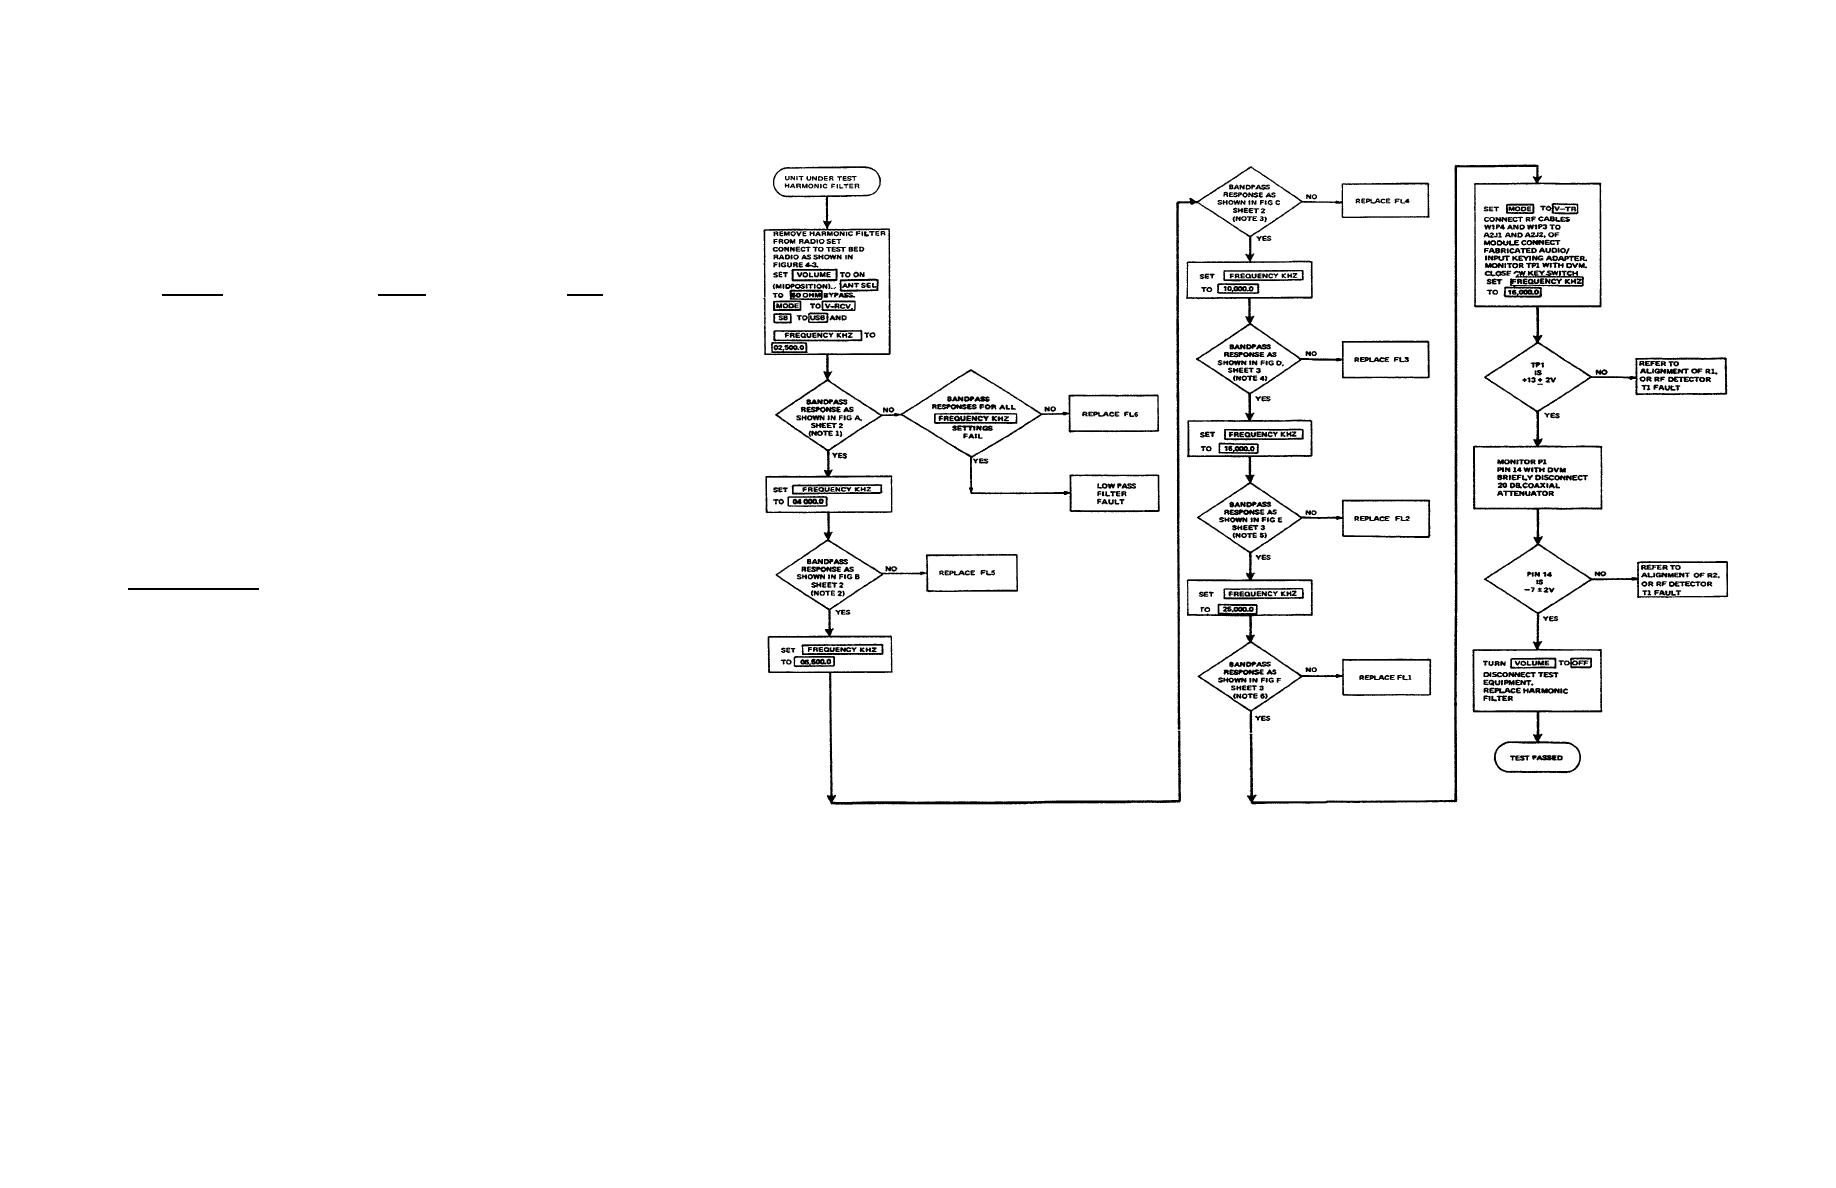
Figure 4-4. Harmonic Filter A1A2 Performance Test (Sheet 1 of 3) |
|
||
| ||||||||||
|
|  TM 11-5820-919-40-2
Figure 4-4. Harmonic Filter A1A2 Performance Test (Sheet 1 of 3)
HARMONIC FILTER PERFORMANCE TEST
NOTE 1:
The narrowband criterion is a maximum of 1.8 db insertion loss in the
passband. A shorting bar, connected between the two fabricated rf cables,
should be used to achieve a 0-db reference. The wideband criterion is
-40 db suppression beyond 3 times the lower band frequency of the selected
filter. To obtain narrow and Sideband spectral outputs as in the figures,
set the controls on the spectrum analyzer as follows:
Controls:
Narrow
Wide
Scan Trigger - AUTO
AUTO
AUTO
Scan Mode - INT.
INT.
INT.
Video Filter - 10 kHz
OFF
10 kHz
Log/CM
2 db Log
10 db Log
Linear Sensitivity - 1
-1
-6
Log Reference - 0
0
10
Scan Time
5 ms
20 ms
Range
0-11 MHz
0-110 MHz
Input Attenuation
50 db
20 db
100 kHz
300 KHz
Center Frequency
2.5 MHz
50 MHz
Scan width
0.2 MHz (Per Division)
.05 KHz (0-100 MHz)
(Inner Red)
Tracking Generator
Function
Track Analyzer
Same
RF Level
O dbm
Same
Each filter can legitimately be checked by at taching the RF signal genera-
tor to A2J1 and the power meter to A2J2; the of signal generator is set to
upper, middle, and lower points on the passband, and the insertion loss
(1.8 db maximum ) is read on the power meter. A zero reference is estab-
lished by connecting the rf signal generator to poser meter.
NOTE 2:
Scan width is 0.5 MHz, center frequency is 4,000 KHz
NOTE 3:
Scan width is 0.5 MHz, center frequency is 6,500 KHz
NOTE 4:
Scan width is 1 MHz, center frequency is 10,000 KHz, range 0-110
NOTE 5:
Scan width is 2 MHz, center frequency is 16,000 KHz, scan time 10 ms
NOTE 6: Scan width is 5 MHz, center frequency is 25,000 KHz, scan time 20 ms
NOTE 7: Unless otherwise specified, all voltage measurements taken with respect to chassis ground.
42
|
|
Privacy Statement - Press Release - Copyright Information. - Contact Us |
