|
| |
TM 11-5820-890-30-5
2-31. TROUBLESHOOTING FLOWCHARTS.
The following flowcharts contain the troubleshooting procedures used to fault isolate an RT to a bad module.
Observe the following when using a flowchart:
a..
b.
c.
d.
e.
f.
g.
h.
i.
Do not start a flowchart unless directed to it by another troubleshooting flowchart or by the operational
check.
Do not change RT or test equipment switch settings unless directed to do so by the flowchart or the
test setup diagram.
Refer to Chapter 3 for information on the reference fixture and the test adapter.
The logic levels in the RT are as follows:
logic 0 = -0.7 to
2.0 V dc
logic 1 = 4.7 to
7.5 V dc
negative logic 1 = -5.0 to -7.25 V dc
See figure FO-13 for locations on the RT parent board.
The test responses at some test points are not seen immediately. Check the probe location and per-
form the test again to verify a faulty result. Try rekeying the radio that is transmitting. Test responses
that are difficult to detect will be supplied with presets for the scope.
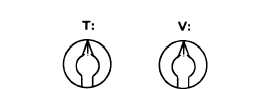
These appear as:
They give the time base (T), and voltage base (V) suggested settings for the scope.
The reference fixture and REF RT are part of Maintenance Group OA-9263A/GRC.
The RT may fail SELF-TEST if a signal is input to the AUD/FILL or AUD/DATA connector during
SELF-TEST. These SELF-TEST failures may be ignored during testing unless the procedure asks for
SELF-TEST responses.
Some of the more common frequencies are as follows.
Frequency
Period
Pulse Width
75 Hz
150 Hz
640 Hz
1 kHz
1.2 kHz
2.4 kHz
2.88 kHz
4.8 kHz
8 kHz
16 kHz
32 kHz
40 kHz
192 kHz
320 kHz
640 kHz
3.2 MHz
13 ms
6.7 ms
1.6 ms
1.0 ms
0.83 ms
0.42 ms
0.34 ms
0.21 ms
125 µs
62.5 µs
31.25 µs
25 µs
5.2 µs
3.1 µs
1.6 µs
0.31 µs
6.7 ms
3.35 ms
0.78 ms
0.50 ms
0.42 ms
0.21 ms
0.17 ms
0.10 ms
63 µs
31 µs
15.6 µs
12.5 µs
2.6 µs
1.6 µs
0.78 µs
0.16 µs
2-51
|