 |
|||
|
|
|||
|
Page Title:
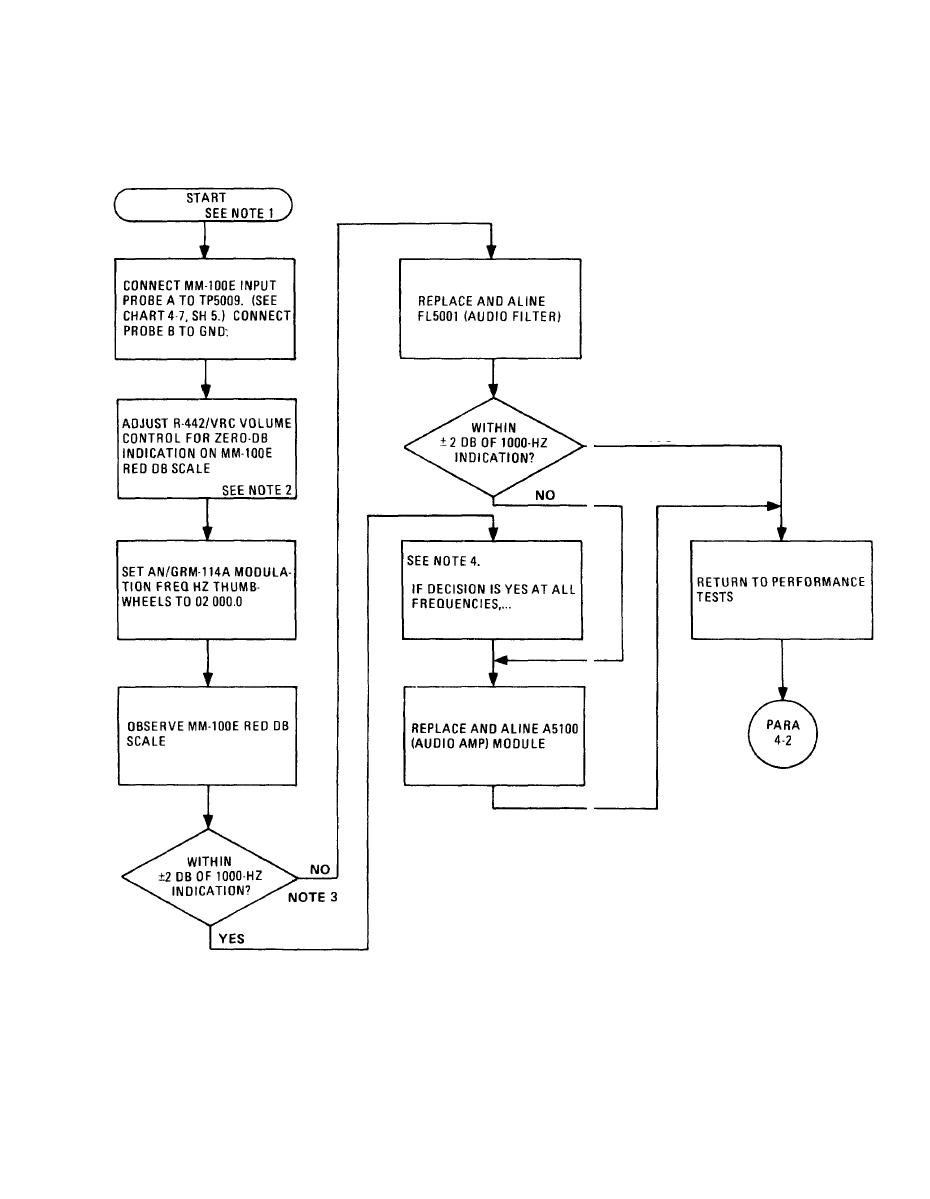
CHART 4-9. Audio Response Test Failure (Normal Mode) Troubleshooting (Sheet 1 of 2) |
|
||
| ||||||||||
|
|  TM 11-5820-401-34-3/-067-LP-432-3060
TROUBLESHOOTING FLOW CHARTS. (CONT)
4-13.
CHART 4-9
Audio Response Test Failure (Normal Mode) Troubleshooting
(Sheet 1 of 2)
NOTES
1. Use same equipment setup as in Performance
Test
The 1000 HZ (MODULATION) reading is used
2.
as a reference, as it was in the Perfor rnance
Test.
Additionally, AN/GRM 114A DEVIATION nwi i!
3.
should indicate 8 kHz.
Repeat last two steps with AN/G RMI 14A
4.
MODULATION FREQ Hz thumbwheels set at
a. 03000.0
b. 00500.0
4-105
|
|
Privacy Statement - Press Release - Copyright Information. - Contact Us |
