 |
|||
|
|
|||
|
Page Title:
CHART 4-4. SINAD Test Failure Troubleshooting A2000, A3000 Assemblies (Sheet 4 of 9) |
|
||
| ||||||||||
|
|  TM 11-5820-401-34-3/0967-LP-432-3060
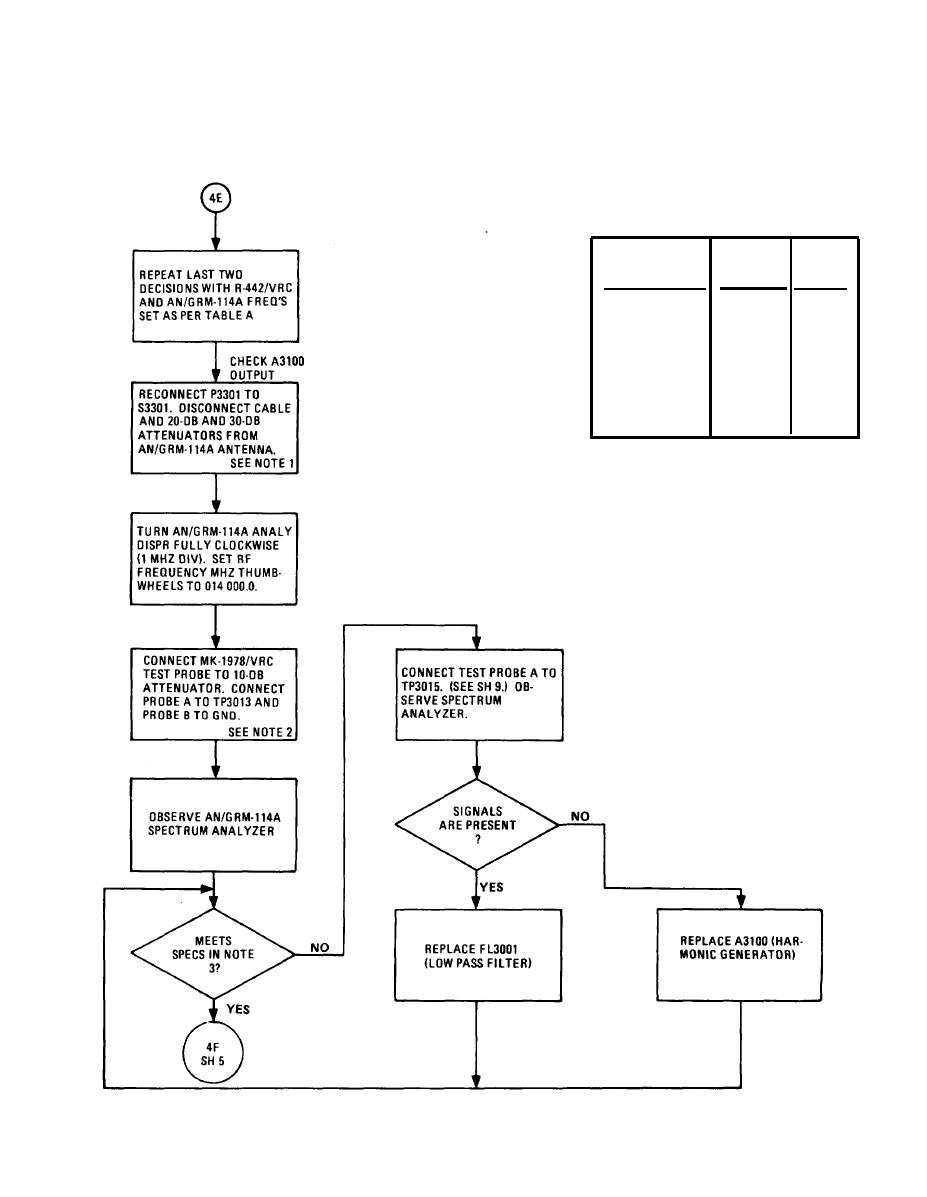
4-13. TROUBLESHOOTING FLOW CHARTS. (CONT)
CHART 4-4
SINAD Test Failure Troubleshooting A2000, A3000 Assemblies
(Sheet 4 of 9)
TABLE A
AN/IGRM-114A
R-442/VRC
IN MHz
CRYSTAL
IN MHz
046950.0
Y2007
XX.05 OR XX.10
Y2008
047050.0
XX.15 OR XX.20
047150.0
Y2009
XX.25 OR XX.30
Y2010
047250.0
XX.35 OR XX.40
Y2005
047350.0
XX.45 OR XX.50
Y2004
047450.0
XX.55 OR XX.60
Y2003
XX.65 OR XX.70
047550.0
Y2002
XX.75 OR XX.80
047650.0
Y2001
XX.85 OR XX.90
047750.0
Y2006
XX.95 OR XX.00
046850.0
X = ANY SETTING
NOTES
1. Leave 10-dB attenuator attached to AN/GRM-
114A ANTENNA input, but do not reconnect
BNC cable.
2. See Sh 9.
3. At 14-MHz center frequencv. wave peaks at
10 MHz, 11 MHz, and 12 MHz should beat
least -40 db. Peaks should fall off at 13 MHz
and above. By 16 MHz or 17 MHz they should
he appox 80 db.
4-79
|
|
Privacy Statement - Press Release - Copyright Information. - Contact Us |
